work
You can sign up for all of Sports Illustrated’s newsletters here, including our flagship newsletter SI:AM. Click here to view an archive of that newsletter.
FEATURES
Northwestern magazine | Purple Press: From the studio to the sidelines, these sports media all-stars all have one thing in common.
Sports Illustrated | Capturing the Emotion of Tom Brady, SI’s Sportsperson of the Year
Sports Illustrated | A Famous LeBron James Cover Made Dreams Come True
Sports Illustrated | In Hockey, ‘If You Saw It, You Missed It’
Sports Illustrated | Dak Prescott Smiles at His Scars
The Philadelphia Inquirer | Author archive, including Inquirer Morning Newsletter editions.
Northwestern magazine | How to Get to Sesame Street
Vox | The complex physics of that viral water bottle trick, explained
Inside NU | Quiet, confident and married, Tre Demps has grown up
Washingtonian | A guy on the Citi Open’s grounds crew practices with the world’s best tennis players
Washingtonian | Arlington tennis star Denis Kudla just wants some respect
U.S. News | Schools hope changes in policy will bridge 'discipline gap'
U.S. News | How gentrification is leaving public schools behind
Inside NU | Ifeadi Odenigbo is just having fun
Inside NU | The rebirth of Collin Ellis
Inside NU | How Chris Collins is building Chicago's Big Ten Team
PROJECTS
GRAPHICS

Baseball history is measured in eras. So, to determine the era with the highest concentration of players named in ESPN's top 100, I calculated the number of these all-time greats per 100 MLB players at the time.

I scraped six decades worth of Billboard data to discover which artists stayed relevant to the public for the longest time by measuring the time between an artist's first and last peak in the Billboard Hot 100.

I illustrated timelines for each MLB franchise, highlighting the years when the club had at least one top 100 player on its roster.
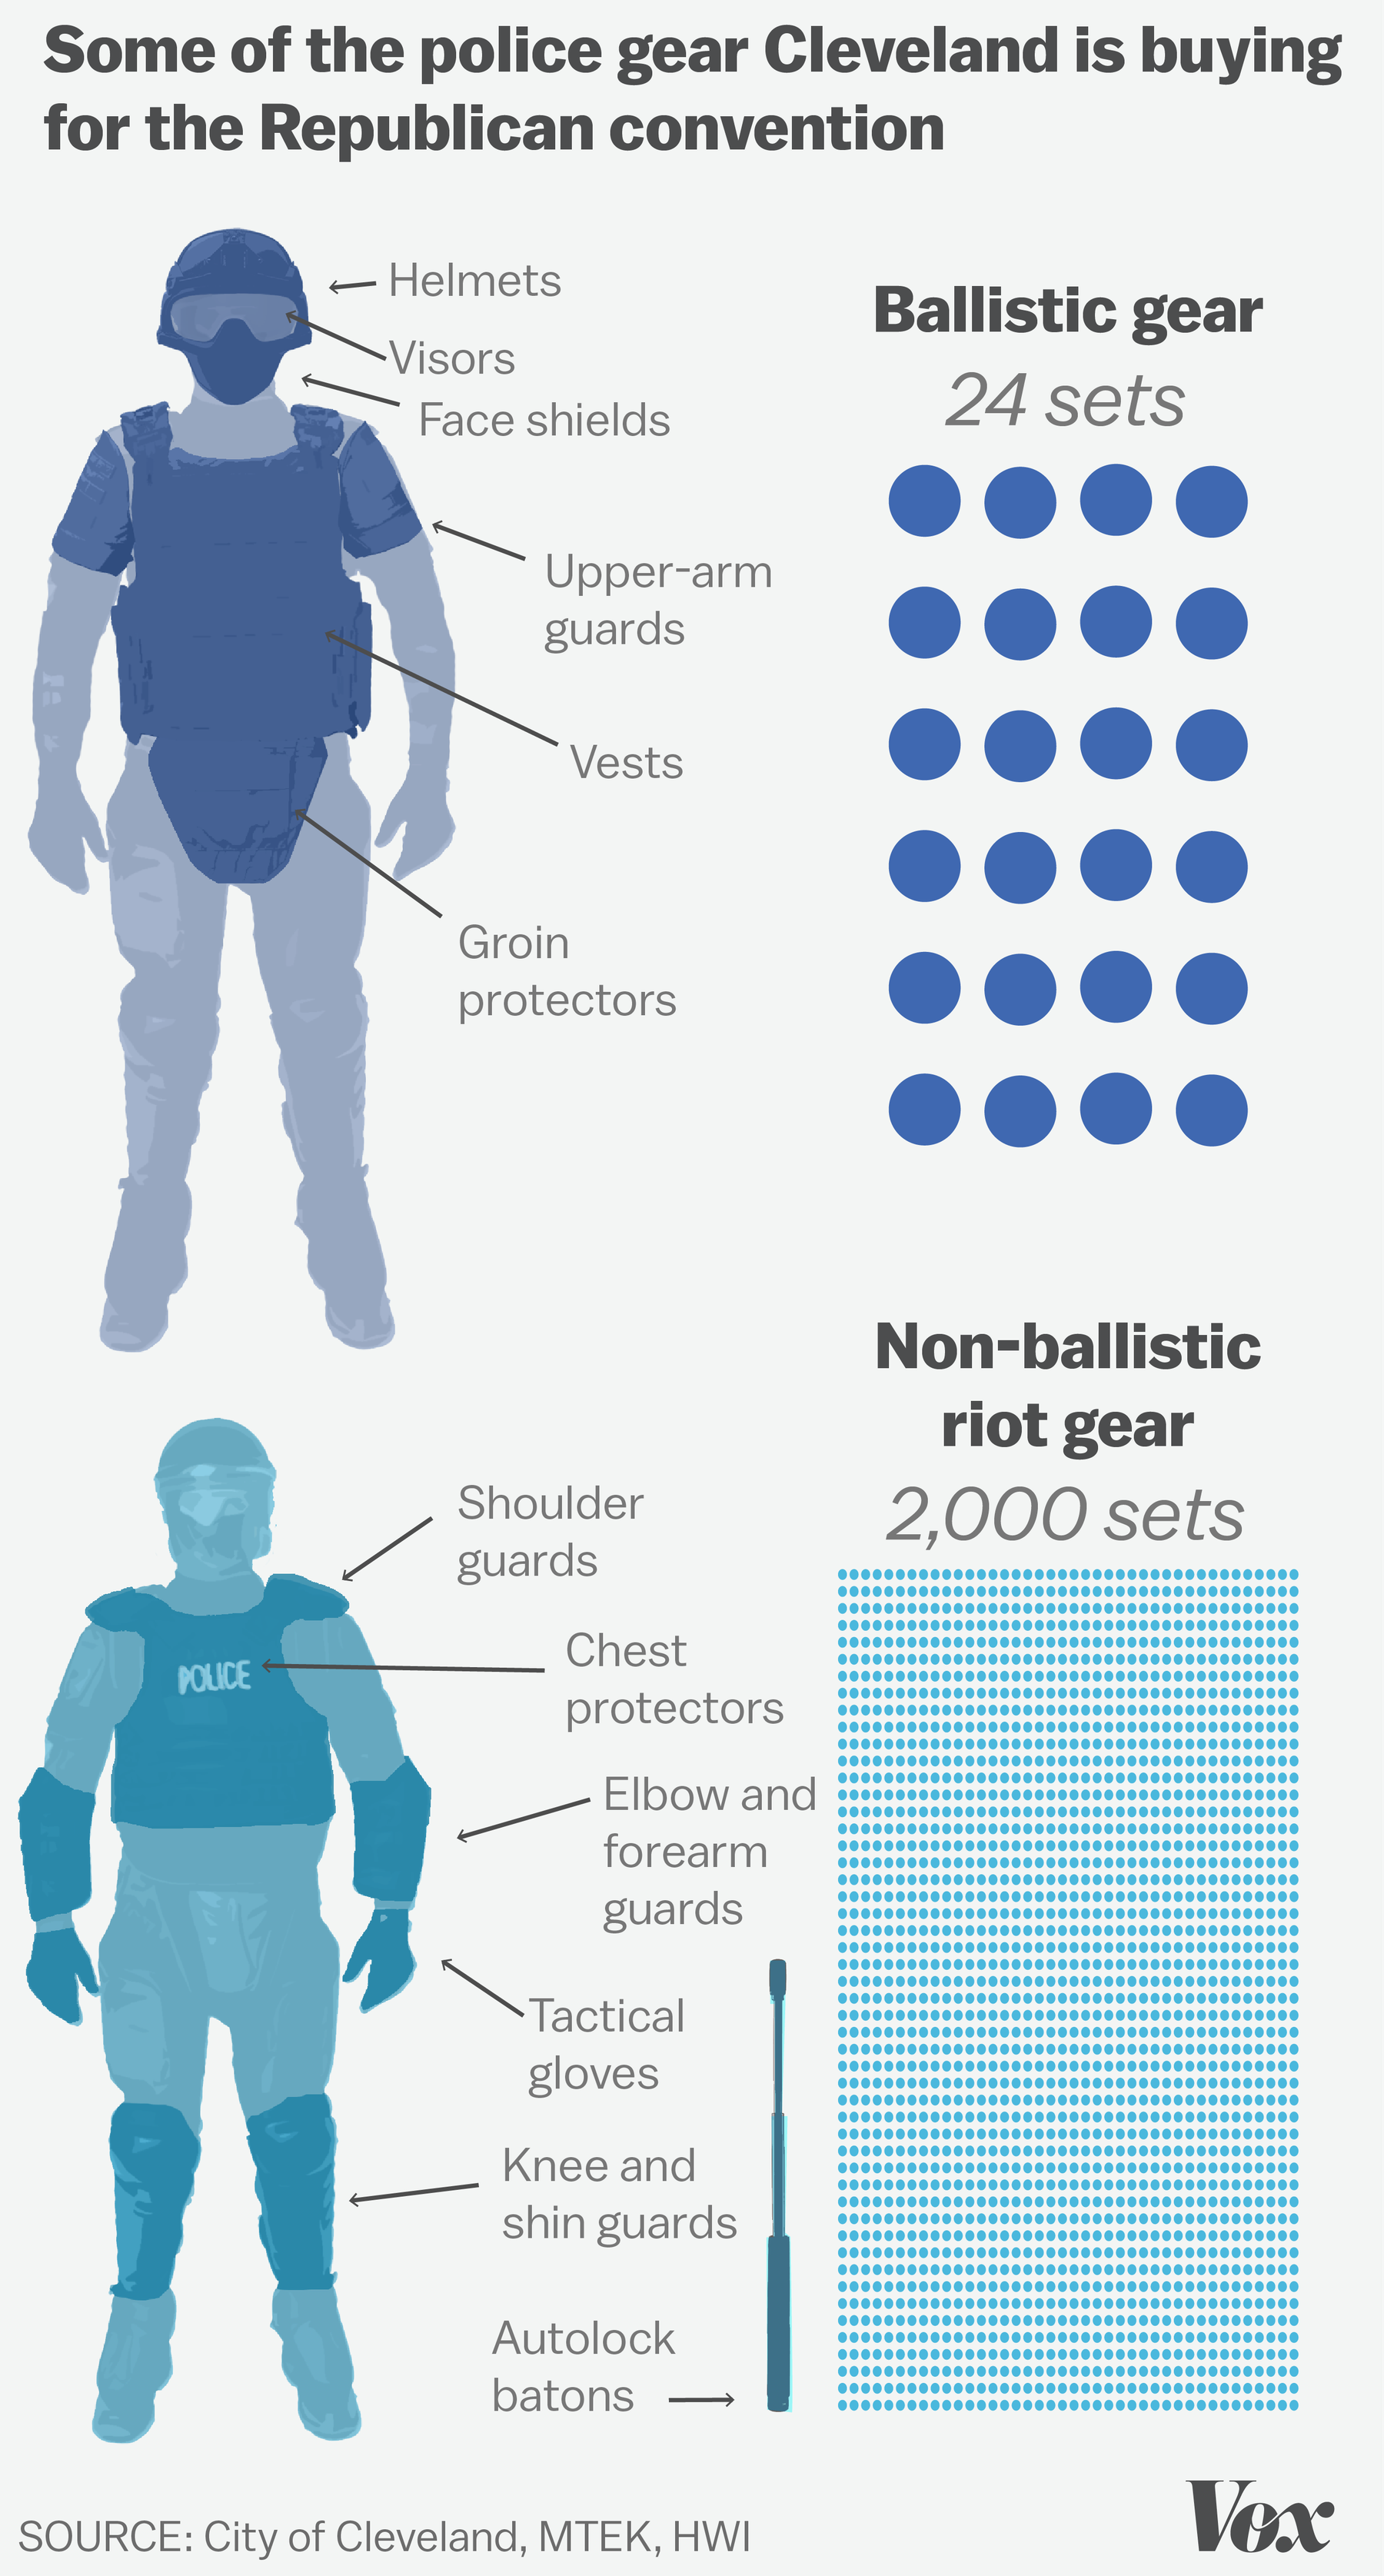
I used publicly available documents to illustrate the gear that Cleveland was buying for its police officers to prepare for the 2016 Republican National Convention.

To compare the AL and NL All-Star starting lineups, I compared each player to his counterpart using the wins above replacement statistic.

To illustrate the price differences for ultrasounds depending on geographic location, I illustrated, to scale, the geographic locations and prices of the procedures in each location. This graphic was featured on Late Night with Seth Meyers.